 |
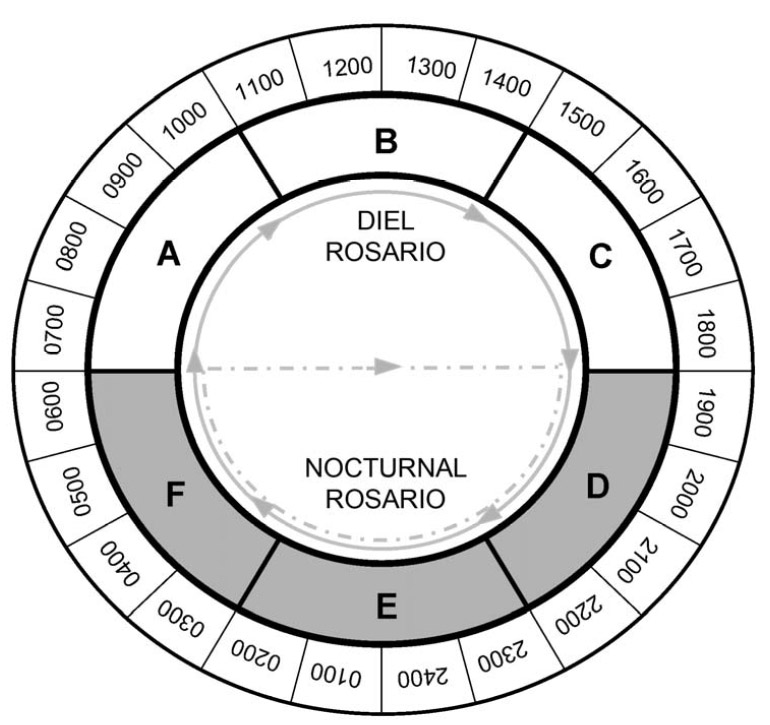
| Diagrammatic illustration of how the ROSARIO algorithm “wraps” distributions of activity along the analyzed time extent. In this example, 6 intervals (A to F) compose the full diel extent. For analysis done at a diel extent, the movement of distributions would be from F to A (solid gray arrows); for a nocturnal extent, the movement would be from F to D (stippled gray arrows); and for a diurnal extent, the movement would be from C to A. |